[Deep Dive] Commodity Demand-Side Information Sources
![[Deep Dive] Commodity Demand-Side Information Sources](https://storage.ghost.io/c/f2/8f/f28f7440-3783-49d5-aa15-ce76155cfc0f/content/images/size/w960/2023/10/ag-info.jpg)
Sign up for Ag Commodities Focus: Stay ahead of the curve on ag commodities trends.
Demand is an ongoing process, and understanding and anticipating it takes careful and consistent attention.
Executive summary:
- A complete look at sources of public information used by firms and traders
- How to create a framework to further analyze demand
- A look at usage segments, feed demand, and domestic versus export demand
- Secondary sources including corporate data, stock markets and the media
Introduction
The foundation for successful trading is information. Information drives analysis and analysis leads to insight. In this companion piece to July’s supply-side edition, we will provide a complete rundown on the sources of public information used by commercial firms and professional traders to assess and analyze demand for agricultural commodities, along with how to convert that information into effective trading strategies.
Less than 5% of the population of the developed world is reported as being employed in farming. The US is the world’s leading agricultural exporter at nearly $150 billion shipped annually, yet less than 2% of the US population is engaged in agricultural production. Modern agriculture is thus, for all intents and purposes, a cash crop raised to be sold and consumed by someone other than the grower.
The impetus for what to grow comes from the aggregate demand of millions of global consumers. But unlike industrial commodities or consumer products, the supply for agricultural commodities is bound by a seasonal production cycle – the cotton crop can’t be increased in January because consumers want new flannel sheets to get through an extra-cold winter.
The complex task of matching demand with available supply is accomplished through price. For the commodity trader seeking to position the market, understanding demand and how it is evolving is a key to understanding and anticipating price movements. Fortunately, by using primary data reported in the market, along with adjacent and indirect information, a trader can effectively equip themselves to track and forecast demand and better anticipate the impact on commodity prices.
To better understand consumption of agricultural commodities, it is necessary to look at demand from both a macro and micro perspective. Understanding long-term trends as well short-term influences is key to developing a robust approach to assessing demand. The best-informed traders will seek to understand the underlying factors that are driving demand over time, as well as the factors that create variability on a more immediate basis.
It is also important to clarify two related but distinct ideas about demand. In ag commodity markets, the term 'demand' is often used in multiple contexts. The first refers to actual usage of a product, typically for a defined time period – i.e., annual consumption of corn in the US. But the term 'demand' is also used to refer to buying interest or actual transactions in the marketplace – i.e., Chinese purchases of US corn. Assessing how transactional demand is fulfilling (or shifting) expectations for long-term consumptive demand is critical to gauging price impacts in the market.
Long-term drivers
The critical drivers of long-term demand are population and income. These two demographics are basic but incredibly powerful predictors. Population as a driver is self-evident. The greater the number of people to be fed and clothed, the greater the demand for food and fiber. Income is also required to create demand – cash to procure the crop. Together, economic growth and rising population increase demand.
Using this knowledge, a framework can be created for drawing long-term demand trends for agricultural commodities. Intuitively, we know that demand is increasing steadily with population growth, but that can be enhanced by looking at consumption on a per-capita basis. Per-capita analysis can highlight changes in demand based on population growth while also identifying changes in demand due to other factors.
The starting reference point for any long-term analysis is annual consumption, as reported by U.S. Department of Agriculture. The USDA maintains historical global supply and demand tables for the major commodities and this archive is the statement of record used by traders.
Each year the USDA publishes an Annual Outlook, with a forecast of demand for key commodities. This baseline becomes the starting point for forward-looking projections and is then updated on an ongoing basis with the release of the USDA's World Agriculture Supply and Demand Estimate (WASDE) monthly report. In producing its initial estimate of demand for a crop year, the USDA relies heavily on historical trends, expected economic growth and the per-capita demand methodology to produce an annual estimate, as reflected in the Annual Outlook. Shown here are two snapshots from the Cotton Annual Outlook.
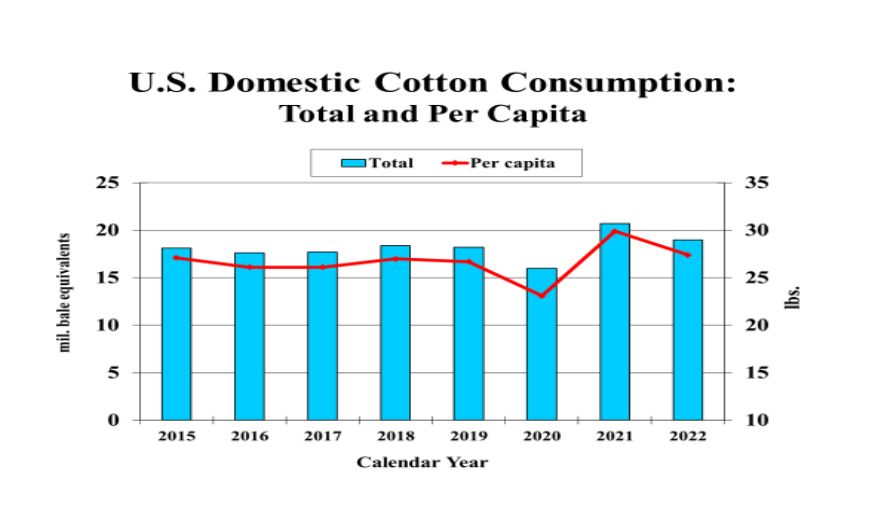
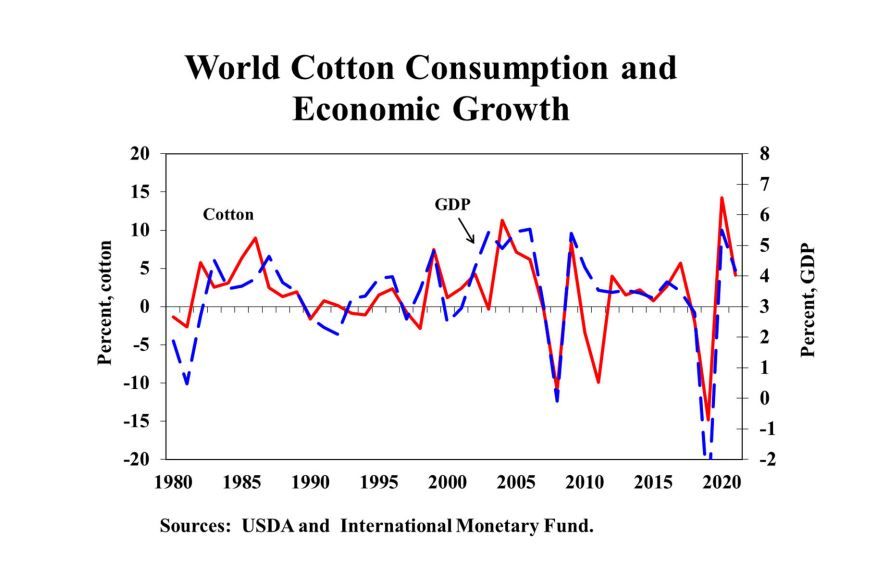
The top chart shows how a steady trend in per-capita consumption can be impacted by external events – in this case a downturn in consumption during Covid-19 lockdowns followed by a rebound above trend in 2021. The 2022 forecast re-establishes demand at per-capita trend level. The second chart effectively highlights the correlation between income and demand.
Framework for further analyzing demand
The drivers of population and income are most useful in projecting long-term demand trends and understanding growth over time. That is certainly valuable for guiding investments in the agricultural sector, but analyzing demand for the purposes of active trading requires a more robust framework.
That purpose requires segmenting the market to better understand the multiple factors that can influence demand on a more immediate basis. Having identified those segments, it is possible to use a series of publicly available sources of both forward-looking projections and real-time activity within the segments to assess demand.
This primary information can be supplemented by looking at sources that are adjacent to the commodity flows themselves. Analyzing consumption across segments on multiple time frames and from multiple industry perspectives allows a trader to develop a more dynamic picture of demand.
Segments
For most agricultural markets, one of the key segmentations is looking at Food, Feed and Industrial uses. The USDA uses this approach in their supply and demand reporting process and these categories are broken out in USDA’s annual estimates. Segmenting demand in this way allows for a more detailed view of crop disposition.
Several of the most actively traded markets illustrate this well:
- In the most recently completed crop year, a little more than half of the US corn crop was consumed domestically as animal feed. The balance of US consumption was split between food use and ethanol production.
- Looking at wheat, US consumption is nearly all for food usage, but globally 20 percent of wheat is used as animal feed.
- The segment dynamic is fully displayed in the soybean complex. A relatively small portion of soybean production is devoted directly to food usage while most of the crop is processed into soybean oil and protein meal. After processing, the food versus industrial split continues. Most of the meal side is used as animal feed but some is used to produce food grade proteins. On the oil side, demand is split across multiple food uses – baking, frying, dressings and sauces – but it can also be used to produce biodiesel for fuel.
Having identified these usage segments, we can now look at the resources available to track and project demand in the sectors. For the major grain commodities (wheat, corn, soy), the USDA’s National Ag Statistics Service (NASS) provides a monthly breakdown of usage.
Data is reported by individual US flour mills, corn processors and oilseed crushers. In addition to reporting the total volume used, the report breaks down the intended consumptive market, such as alcohol for fuel or corn processed for corn syrup. With this tool, market watchers can track by category each month how closely domestic usage is aligning with annual USDA estimates of demand.
While the NASS reports provide some information on the initial processing of commodities into fuel, the US Energy Information Administration (EIA) provides a more complete picture of biofuel data. Initially focused on fossil fuels, the agency has now fully incorporated renewable fuels into its reporting framework, providing monthly data on production, consumption, stocks and trade of fuel ethanol, biodiesel and renewable diesel. When this data is paired with the EIA’s petroleum data, a true picture of agri-based biofuels' role in fulfilling overall energy demand emerges.
Feed demand
Per-capita consumption analysis is a great tool for looking at aggregate demand on a national or global scale, but we know that much of grain and oilseed consumption is not by people directly but indirectly in the form of meat. The ‘population base’ driving demand is actually hogs, chicken and other species being fed these ingredients. Fortunately, counting chickens (and hogs) is easier than counting global population.
On a quarterly basis, NASS produces a Hogs and Pig Report with a complete inventory of hogs in the US, including a breakdown by age. This level of detail adds value for demand assessments, as hogs being readied for market will consume differently than a baby pig in the weaning stage. By tracking changes in swine population and age, a market analyst can model changes in consumption of primary hog feed ingredients.
Similarly, NASS produces a monthly report on the poultry industry. Answering an age-old question, the report starts with egg placements, broken out by those intended for consumption as eggs and those intended to be raised as chickens – both for production of more eggs (layers) and chickens for meat (broilers). Here again, feeding implications change with profile. Similar reports exist for cattle, both dairy and beef, with equivalent breakdowns to account for age and end-market destination.
In addition to this population-based data, NASS reports pounds of meat produced. This can be used as a backward-looking metric to correlate historical demand for feed ingredients with historical production of meat.
Domestic vs. export demand
The data provided by NASS and the EIA provides an excellent picture of domestic demand, but of course demand is not limited to the US as commodities are produced and shipped globally. The price required to transfer exportable surplus to deficit demand is the ultimate determinant of commodity value.
With the US as a predominant supplier of grain, oilseeds and cotton to global markets, it is critical to be able to forecast and track export flow to truly understand demand and anticipate price movements. Fortunately, there are several good sources for monitoring and anticipating export commodity movements.
As part of the Annual Outlook, the USDA forecasts annual global trade flow. Monthly WASDE reports further breakdown this information by listing volumes for major exporting and importing countries along with beginning and ending stock levels for these countries.
It can be useful to look at trade flow along with stock changes and where they are projected to occur. Declining or low stocks in an exporting country suggest there is less capability to respond to a demand surge, while a build of stocks in an importing country might indicate a ‘push’ of global surplus to a new home. The implication of the first is bullish (the price may need to rise to ration unexpected demand) while the second has a bearish tilt (a new home for stocks can only be created at attractive prices.) The extent to which either of these scenarios may be coming into play can be best assessed by looking at more granular trade flow data,
The most timely and accurate trade flow reports come from the weekly USDA export sales reporting system. Exporters of US commodities must register their sales each week, declaring the recipient country. Physical shipments are also captured in the reporting process.
These registrations and shipments are compiled and then made public on a weekly basis. The report tracks year-to-date progress and includes a reference to data from the previous year, which facilitates comparisons to the WASDE annual estimates. Destination information is limited to US shipments only, but those do provide a good indicator of the level of buying activity and the pace of physical shipment to key markets.
The timely nature of the report and the destination detail make the weekly export sales report highly followed and anticipated by traders as any changes in anticipated demand will be reflected.
To further supplement the weekly report and minimize surprises, the USDA has established a daily reporting requirement to capture any individual sale or any aggregate sales to one destination above established thresholds. These ‘threshold’ sales must be reported within 24 hours of concluding the business. Below is an example of how traders might track weekly export sales reports through the year to create a picture of demand. The examples below look at US cotton activity, which uses an August-July marketing year (August 1, 2022 = Week One in the chart):
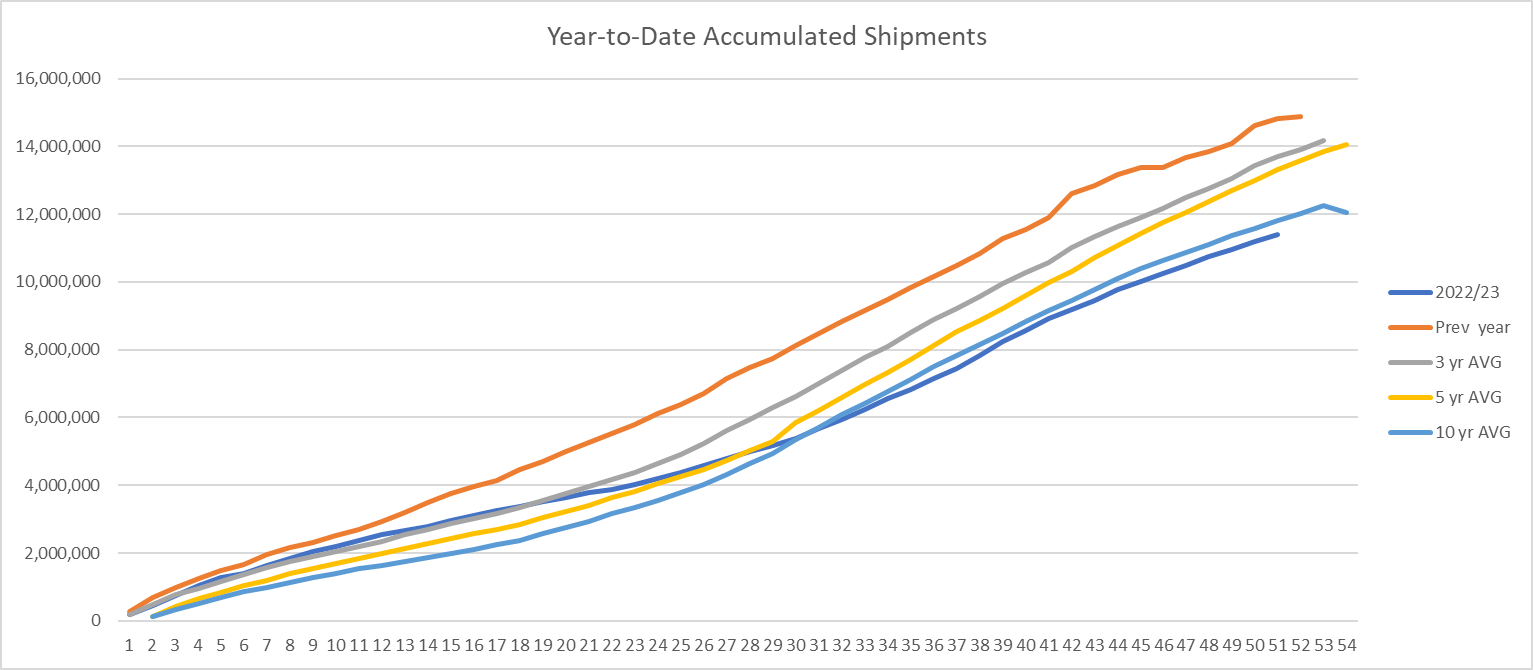
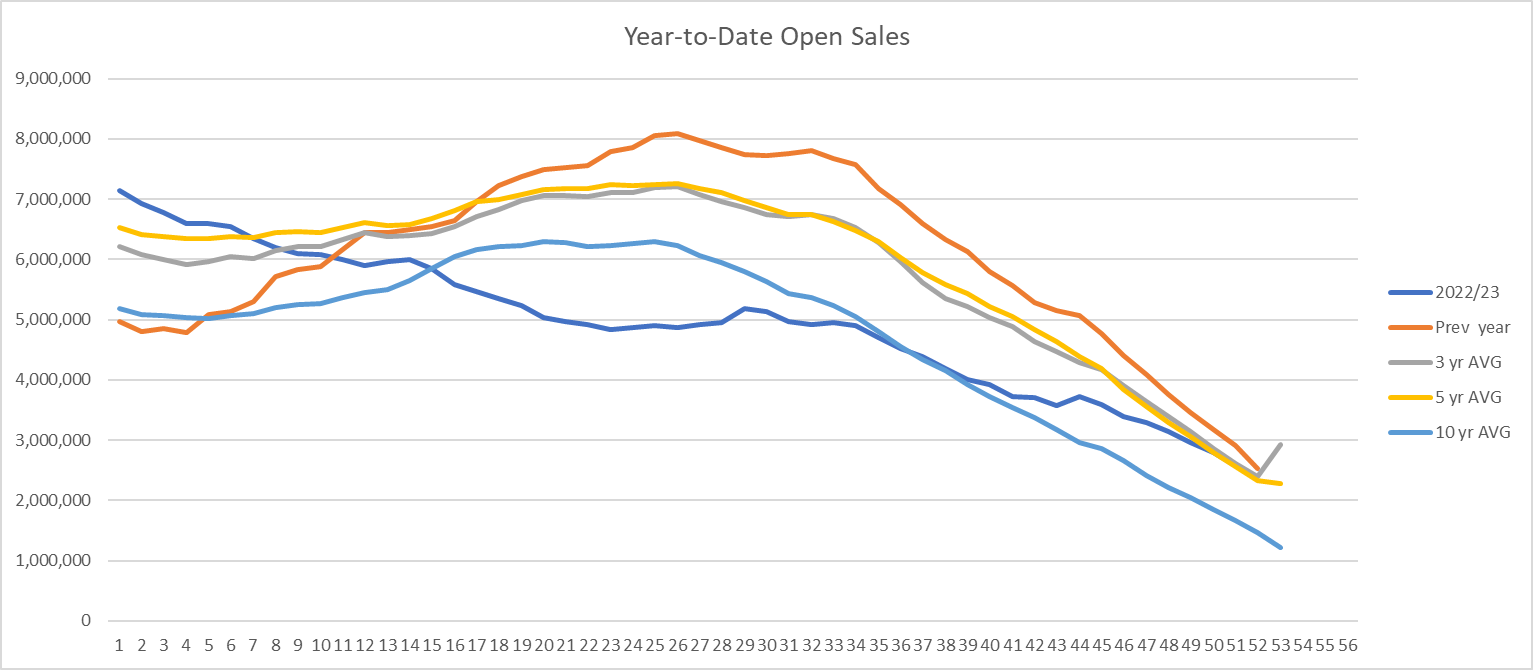
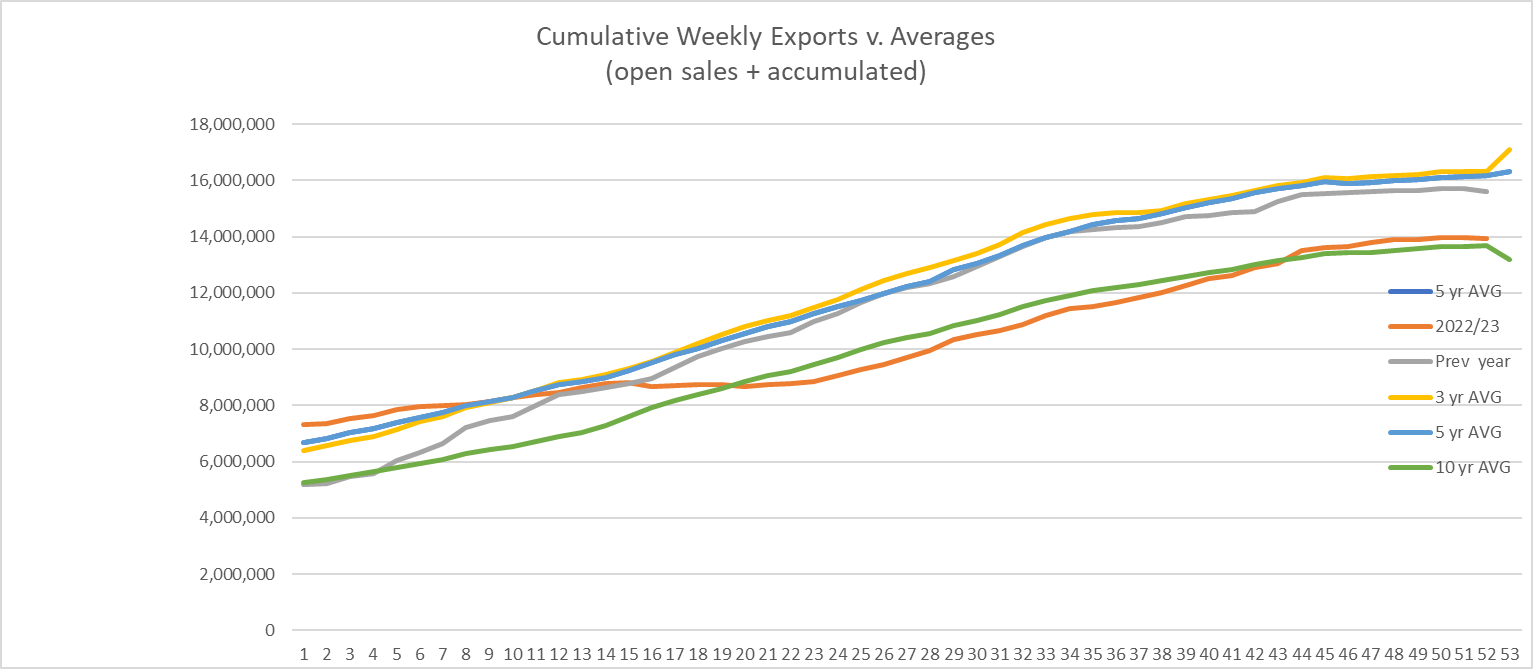
Note in the bottom chart how cumulative export activity for 2022/23 narrows the gap versus history in the second half of the year, suggesting an increase in the pace of forward commercial sales. In contrast, the top chart shows how physical shipment for 2022/23 lags the prior year and long-term averages, particularly in the last quarter, suggesting a reduction in physical activity. This can then be compared with the month-by-month evolution of WASDE estimates of annual cotton exports:
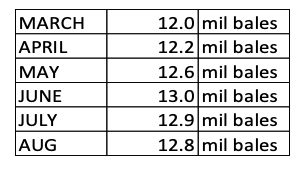
By monitoring the weekly activity, the subsequent WASDE changes could be better anticipated and positioned in the market.
Secondary sources
We have discussed how USDA data can be used as a primary resource to forecast and monitor demand for agricultural commodities. But there are additional, secondary resources that can add to the understanding of demand. These secondary sources can be insightful in the price discovery process as oftentimes the market is less concerned with the absolute level of demand than with the anticipation of changes in demand. A partial listing of those is offered here.
Corporate Data: Nearly every segment and commodity discussed above is represented by a major publicly traded firm – Tyson, General Mills, Pillsbury, Levi Strauss – which uses commodities. Each of these firms regularly issues earnings reports and hosts analyst calls to keep investors posted on their performance and outlook. A careful reading of these materials can provide a direct perspective on the demand for raw materials as well as potential insights on pricing and margin pressure, which could impact consumption. A significant press release or announcement can be the catalyst for a change in demand (e.g. Tyson is closing four plants as chicken sales slump, CNN Business).
Stock Market Performance: The stock market is an active barometer of winners and losers in the market. Rising or falling in the eyes of the investment community can be a leading indicator of growth or decline in demand from a sector. Stock valuations can be especially helpful in looking at foreign firms where published estimates of demand may not be as readily available as the NASS data for US consumption.
Popular Media: Developing a consistent trading strategy just from reading headlines is unlikely to be effective, but a prudent trader should not ignore the news of the day, particularly in assessing demand. Fad diets, fashion trends, cross-border tensions, health concerns and other events can all be linked to step changes in demand.
Correlating what is heard on the street with what is seen in the market is at the heart of successful trading.
Price is determined when supply meets demand. For most agricultural commodities, supply is an ‘event’ with harvest as a finish line. Demand, by contrast, is an ongoing ‘process’ evolving in real time and driven by seen and unseen factors. In this respect understanding and anticipating demand requires careful and consistent attention.
Trading strategy is based on the author's views and analysis as of the date of first publication. From time to time the author's views may change due to new information or evolving market conditions. Any major updates to the author's views will be published separately in the author's weekly commentary or a new deep dive.
This content is for educational purposes only and is NOT financial advice. Before acting on any information you must consult with your financial advisor.