Global Ag Trade: A Fundamental Analysis
Sign up for Ag Commodities Focus: Stay ahead of the curve on ag commodities trends.
Author: Doug Christie
Part 1: Analytical Framework
For decades, global trade of agricultural commodities has enabled growth, promoted investment, created value for farmers and raised living standards of consumers around the world. And while cross-border flows of most commodities remain robust, there are emerging signals of disruption in the long-term trends and trade patterns that have been key drivers of global trade over the past twenty years.
As these forces play out, commodity futures markets will be impacted. Understanding the underlying foundation, as well as the nature of changes, can help market participants both anticipate and react to the evolving landscape.
Agronomics is Key Driver of Supply
As an industry, agriculture is unique in that it is fundamentally tied to the land. Successful production requires suitable land and environment. Agronomically, grains have the most breadth while tropicals such as cocoa and palm are constrained to a narrower latitude. And while much of the planet can support ag production, a relatively small portion of available land is dedicated to production agriculture.
According to the most recent estimates by the Food and Agriculture Organization of the United Nations (FAO), 1.4 billion hectares globally is devoted to cropland. That’s less than 10% of the total land surface area of the planet.
Even more remarkable is that while area under cultivation has grown steadily in absolute terms, cultivated area per capita has contracted.
From 1961-2016, while global population doubled, cropland per capita declined from .45 hectares to .21 hectares. The ability to feed a steadily growing population with relatively less land speaks to the impact of specialization and technology on global ag productivity.
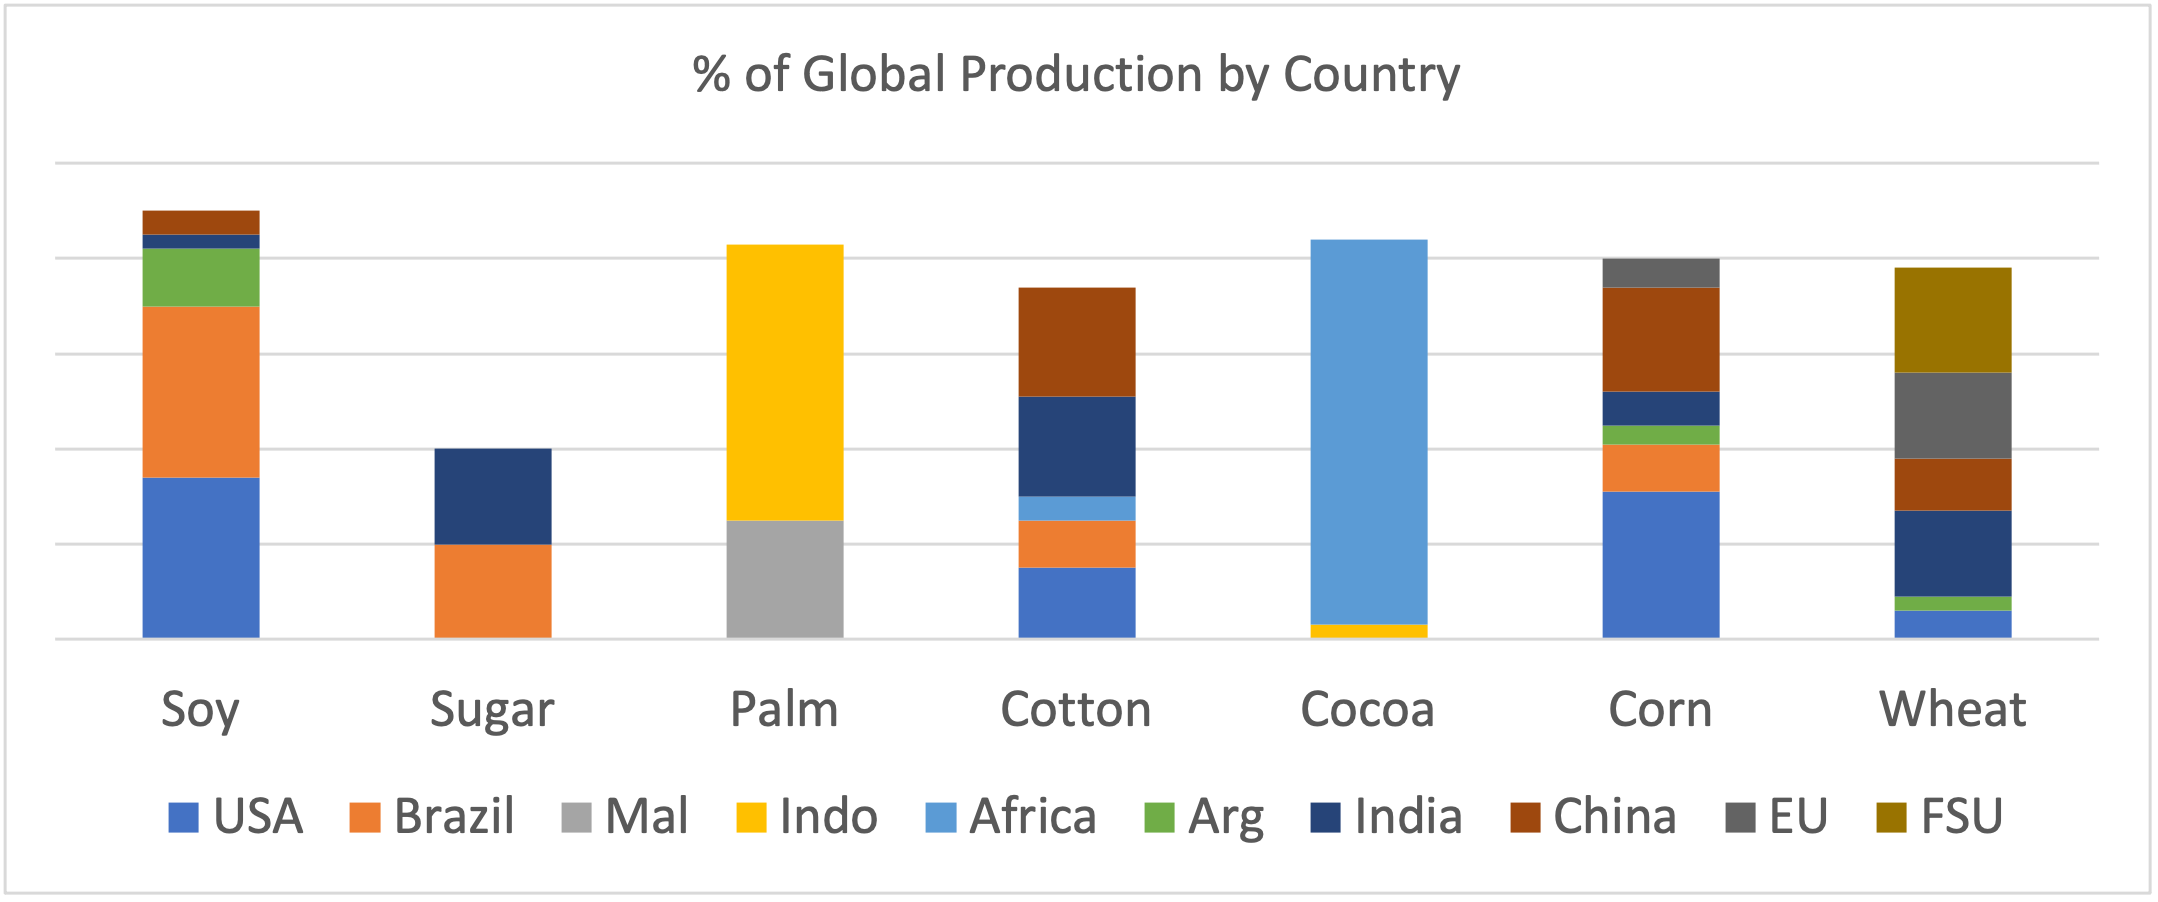
That impact is even more profound when looking at a specific commodity level where a handful of countries play an outsized role in producing the global supply of several key commodities.
In most of these instances, the inherent competitive advantage of geography has been further enhanced by concentrated investment in inputs as well as supporting transportation and handling infrastructure.
Population and Income Are Key Drivers of Demand
While supply is rooted to the land’s productive capacity, demand is a numbers game of mouths to feed and the income to be able to feed them. Both play a significant role as drivers of long-term trends with income volatility also playing a role in the shorter-term demand outlook.
Global population growth as a driver of food demand is self-evident but demographics within populations are also important with younger populations consuming at higher levels.
The cafeteria trays coming through a university dining hall look quite different versus an elder care facility, even though both may have the same number of residents!
Age plays a partial role in the type and amount of food any individual consumes, but a more significant driver globally is income. The growth in global per capita GDP has been transformative for the demand for agricultural products. From 1980 to 2000, global per capita income doubled from roughly $2500 to over $5000. In the ensuing years, income more than doubled again, climbing to over $11,000 prior to COVID.
At higher levels of income, diet shifts from basic foods consumed with limited preparation to diets comprised of higher valued and more processed foods. This may not sound friendly for the demand for so-called ag ‘commodities’, but the impact is less grain is consumed as grain itself and more in the form of meat, along with oils and fats, sweeteners and beverages is significant.
This impact is most profound at the lower end of the income spectrum. Growth in income per capita at the lowest levels translates nearly dollar for dollar to additional food spending while growth in the $1000 to $10,000 range drives exponential increases in higher valued food consumption (such as meat) before plateauing above $20,000.
The relationship between population and income as drivers of demand can be illustrated by looking at corn consumption across three sample countries: Nigeria, Vietnam and South Korea.
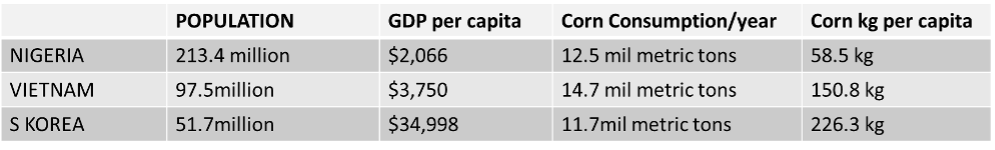
Each of these countries is a major user of corn but with different drivers of consumption. Nigeria’s huge population base supports consumption, despite lower income levels. South Korea is an example of higher income driving consumption while Vietnam lies in the middle. The growth potential from rising income levels is seen in the 2.5 times greater per capita consumption levels in Vietnam while the plateau effect is evidenced by only 50% higher usage in South Korea, despite having nearly 10 times greater income per capita.
It is also interesting to note the pace of population growth in Nigeria and Vietnam (2.4% and .7% respectively) in comparison with South Korea’s stagnant and aging population. Taken together, the ideal growth environment for ag commodity demand is a confluence of a large, young and rapidly growing population base where incomes are rising from modest to median levels.
Cross-border Trade Drives Global Supply and Demand Balance
Competitive advantages in agronomics coupled with inputs and infrastructure enhance supply and create production surpluses at origin. (Despite having his own cow, the farmer’s family can only consume so much milk and cheese!)
To generate value from the surplus requires trade. In the same way, growth in population and income create aspirations for quantity and variety of food consumption that outpace local production capabilities.
Free trade allows those aspirations to be fulfilled and the associated price actions send signals to both origin and destination in a virtuous and self-correcting cycle. The West African farmer will produce more cocoa to the extent the UK consumer has a taste for chocolate and the availability and affordability of cocoa to candy makers perpetuates the British sweet tooth.
While this may seem elementary and light-hearted, the impact of a fluid global trade environment can be seen in some dynamic real-world examples.
From 1980-2000, the Chinese economy grew at average of 9.8% per year as GDP per capita climbed from less than $200 to nearly $1000, according to World Bank data. Yet over that period, China remained a minor feature in world agricultural trade. From 2000-2019, the economy grew at a similar pace (9.1%) per year, but China’s entry into the WTO in 2001 marked a period of remarkable growth and investment in global agriculture.
Within 10 years, China became the single largest importer of soybeans, cotton and vegetable oil and emerged as major factor in global imports of corn and sugar.
Chinese demand prompted explosive growth in South American soybean production, leading Brazil past the United States as the world’s leading producer of soybeans and prompting Argentina to become the number one exporter of soybean meal.
Global oilseed processing capacity exploded, with investment by local and international firms to crush imported soybeans in China. Infrastructure expanded to handle more and larger vessels across multiple Chinese ports.
More recently, the Russian invasion of Ukraine demonstrated the criticality of cross border trade while illustrating how prices anticipate and react to supply and demand events.
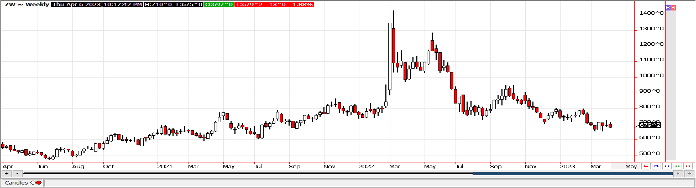
At the onset of the conflict, wheat futures climbed dramatically on fears of market disruptions. Understandable perhaps, given that both Russia and Ukraine produce sizeable wheat crops. Closer market observers, however, would have noted that wheat has among the most diverse production base of major commodities (see Chart 1 above) and an even more fragmented trade flow. Russia accounting for 19% of global trade to Ukraine’s 8%, favored a cooperative approach from Moscow to maintaining grain exports through the Black Sea. At the same time, Canada’s production bounced back from a prior year drought.
Finally, the initial spike in prices prior to Spring sowing decisions generated an increase in area devoted to wheat globally and a decrease in secondary usage of wheat as animal feed. Collectively, this has balanced supply and demand and prices have fallen below pre-invasion levels.
Marginal changes in Trade Flow are Key Driver of Price Movements in Major Futures markets
Economics 101 prescribes that the intersection of Supply and Demand determines price, and that changes in price will influence both the availability of and appetite for any item. But looking at supply or demand figures in absolute value does not provide much insight into price discovery for ag commodities. What is a global supply of 700 million tons of wheat or 42 million bales of cotton actually worth?
The answer to that lies in looking at marginal changes in exportable surpluses, where those surpluses can be stockpiled and at the size and location of demand deficits.
It has been discussed in the earlier sections of this piece how trade is the creator and determiner of value. A snapshot of the tradable volume of some major commodities helps to illuminate this. The Russia-Ukraine situation is an example where a major disruptive event (war) was, after an initial reaction, mitigated to an event with limited market price impact. With only 26% of global wheat moving cross-border, it can be inferred that global consumption of wheat is largely met by internal production. The Indian flour mill who has never relied on Ukrainian wheat is little impacted by the events, despite India being the second-largest user of wheat in the world.
Additionally, as exporters of wheat, the FSU countries are relatively well-positioned to stockpile while outflow is disrupted, and wheat quality (unlike vegetables for example) can be maintained during the holding period so that supply is delayed rather than lost to the world market.
By contrast, a crop failure in Argentine soy production will need to be rationed nearly ton for ton in the World market, as Argentina exports 75% of its crop of soybean products. Alternative export origins are limited, with only 3 nations accounting for virtually all of the global surplus.
In other words, a reduction in supply from Argentina is balanced largely through reductions in demand, while a reduction in Black Sea exports can be offset by responses from multiple origins and destinations.
Cross-Border Trade as percent of Global Production in Key Crops:

Part 2: Current Landscape for Trade
China’s economic growth and openness to trade have been a defining feature of global agricultural over the past two decades. Chinese demand has dominated global trade flow and driven price action in multiple commodities. The China ‘tailwind’ has set the direction and pushed the pace for infrastructure investments with growth in the global soybean complex being the most notable. Today, important economic, demographic and political changes are changing the outlook for China’s place in global agriculture.
The pace of growth in the Chinese economy is slowing. After nearly 40 years of growth averaging 9% annually, the Chinese economy grew at only 3% in 2022. More telling, however, is the government’s stated goal of 5% economic growth for 2023.
With this, China is signaling an expectation and willingness to accept lower growth rates in their economy going forward, perhaps for years to come. And, economic growth in China is slowing at the point on the income curve where the marginal impact of income growth on food consumption is waning. In the years to come, the next $10,000 per capita of income in China will take longer to emerge and the food demand increase from that growth will be less impactful. Taken together, it is likely that China’s role as the key economic engine for global agriculture will be relatively diminished versus the past several years.
Chinese population growth is also slowing. 2022 marked the first year of population decline in China. The prospect of declining population was previously identified by Chinese authorities, who responded by repealing the ‘one-child ‘policy in 2016. But reversing decades of restriction has proven challenging with China mirroring many other developed countries who have also seen declining birth rates as incomes grow. The shrinking and aging of the Chinese population mitigates another growth driver versus the previous boom period.
Perhaps most significantly, China and its trade partners are showing a shift from the ‘pro-trade’ environment which has been so critical to promoting growth in global agriculture. Signed in Jan 2020, the US-China Economic and Trade Agreement called for $200 billion in purchases from the US over the life of the agreement. Phase 1 of the pact targeted a $12.5 billion increase in the Chinese purchases of US ag goods in 2020 and a total of $80 billion in purchases by 2022.
After some initial increase in year one, ag trade between the US and China has plateaued at levels well below the targeted pace and relations between the two countries have cooled significantly over the past 12 months with no meaningful discussion to move beyond the initial Phase 1 deal.
China’s dealings with Australia are another example of the complex relationship between global politics and agricultural trade. While the two countries signed a free trade pact in 2015, the relationship has been challenging for both nations.
With Australia an outspoken critic of China on a variety of issues such as Huawei and Covid origins, China stated its intention to increase inspections of in-bound Australian ag products. Relations further deteriorated when China made price dumping clams on Australian barley, eventually imposing counter-vailing duties on Australian barley in 2019. The duty effectively halted all barley trade from Australia to China and resulted in Australia filing a WTO case against the Chinese in 2020.
Just a few weeks ago, three years into the dispute, the countries appear to have reconciled on this issue with Australia dropping the WTO barley case and China suspending duties. This comes just as Australia is poised to harvest a record wheat crop in the 2022/23 season. Expedient for both with Australia needing markets for the larger crop and China in position to re-stock at prices below previous two-year levels.
The most powerful and telling indication of the changing posture toward global agricultural trade has come from President Xi himself. Speaking at the Chinese People’s Political Consultative Conference in March, Xi indicated that China must not “rely on the international market” and stated an objective that “Chinese bowls are mainly filled with Chinese food”. This would mark a significant departure from years of China fueling its growth in food consumption with imported ag products with both short and long-term implications. A snapshot of 2022 US ag exports to China shows how critical the trade flow has been to US agriculture and highlights the disruptive potential.
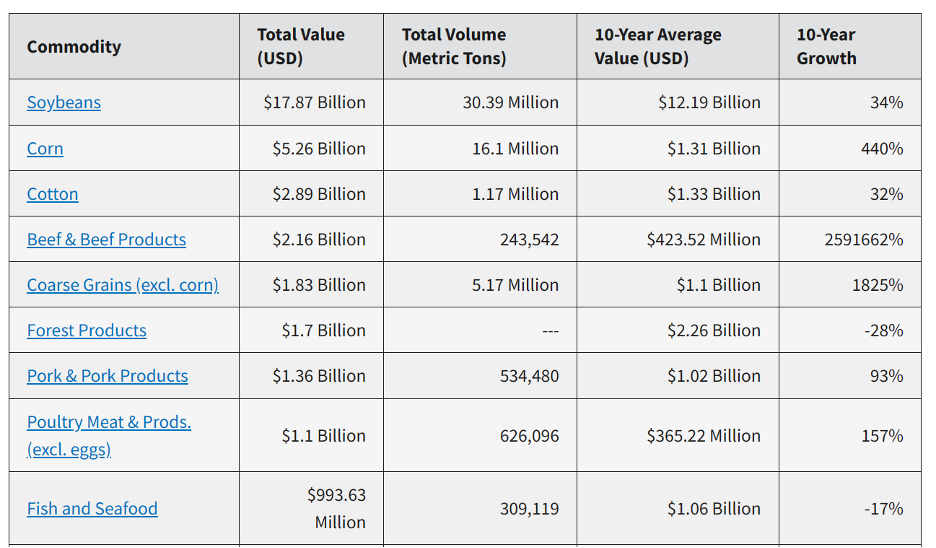
Clearly, China’s move to a higher-valued, more meat dependent diet has created tremendous growth for US products – soy and corn to feed livestock in China as well as direct imports of meat itself.
How would a relative shift away from imports in favor of domestic consumption play out in markets: For China to fulfill its pledge of greater food self-sufficiency, several factors would need to be in play.
Increase domestic oilseed production at the expense of other crops. Oilseeds import for domestic livestock feed has been the key feature of China’s diet evolution, but crop patterns within China have not mirrored this. A re-alignment of acres inside China away from grains and toward oilseeds would help correct the imbalance. China could then look to increase grain imports as needed to offset any domestic acreage reductions. This would have an added benefit of allowing China to increase trade with politically favored partners (e.g. Russian wheat) while minimizing reliance on US soy. Taken together, these actions would favor a relative value gain for grains versus oilseeds in futures markets.
The path toward self-sufficiency is likely to be an austere one and any flattening of the China growth curve is a bearish influence on all major ag markets. China is better positioned to commit its population to the austerity and can control imports so that price signals that may increase consumption elsewhere may not prompt a response from within China, implying longer cycles to any supply driven bear markets.
Agriculture globally has benefitted greatly from the past two decades of population and income growth, led by the rise of China as the dominant consumer. As that influence wanes, prudent market participants and ag investors will keep eyes fixed on the fundamentals driving global trade.