Supply-Side Commodity Information Sources
Sign up for Ag Commodities Focus: Stay ahead of the curve on ag commodities trends.
Author: Doug Christie
The foundation for successful trading is information. Information drives analysis and analysis leads to insight. Over the next two deep dives, we will provide a complete rundown on the best sources of information for the agricultural commodity trader along with some tools and techniques to start converting information into effective trading strategies. This paper focuses on supply side inputs.
An overview
In the 1983 movie Trading Places, in addition to disrupting the life of their nephew over a nature-versus-nurture inspired bet, the scheming Duke brothers conspire to steal a crop report and use that ill-gotten information to corner the market for Frozen Concentrated Orange Juice.
And while the fictional Duke & Duke Commodities never existed and the FCOJ futures market traded its last open-outcry contract in 2012, the pursuit of insight into supply and demand reports is real and as critical to markets today as it was to the plot of the classic comedy. Fortunately, market insight can be gained, not with elaborate schemes, but from an understanding and applied use of the multiple public resources available to today’s commodity trader.
For stock market traders, the companies themselves are the primary source of information. Listed firms must follow government-regulated reporting requirements. Companies publish audited results, provide forward-looking guidance, host shareholder and analyst calls and more, all intended to inform current and potential investors. Click the “For Investors” tab on any major listed company’s website and you get straight to the source.
Unfortunately, corn stalks and cotton bolls don’t put out press releases, so market participants need an external source to serve as a primary data base. For most of the exchange-traded commodities, the U.S. Department of Agriculture is that source. Established in 1862 under President Abraham Lincoln, the USDA has multiple sub-agencies within the department devoted to the production and maintenance of key agricultural market data. Each sub-agency has a slightly different orientation and approach, but collectively the USDA system represents the go-to resource for market participants.
To begin understanding the abundance of public data, it is helpful to create a framework to categorize the reports available. An initial categorization separates reports into ‘Supply’ or ‘Demand’ focused, then looks at the timing and tenor of the information. A final consideration can be given to the source and context of the report. With this framework in place, the foundation to convert information into analysis and insight can ensue.
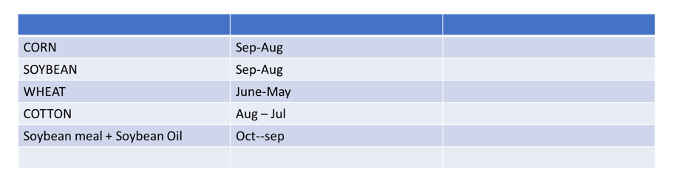
Before looking further at these categories and information within each, a point of clarification. Unlike financial reporting which typically follows a calendar year or company-designated fiscal year, agricultural data is organized by crop year. By convention, the crop year begins at the onset of harvest of a crop and concludes 12 months later. For most North American crops that means a late summer or early autumn beginning and a middle-to-late summer ending. While the actual timing of harvest will differ from year to year, a standard crop year convention is always applied. In most citations, the crop year references both of the calendar years it spans – e.g. 2023/24 designating the harvest period beginning in autumn 2023 and the ensuing 12 months. In cases where only a single year is given (e.g. 2023), it can be assumed the reference is to the relevant harvest period.
Because Northern Hemisphere crops historically comprised most of global production, the same timing is still applied to Southern Hemisphere crops, even though their physical production cycle is out of phase by six months. The Southern Hemisphere crops are slotted into the global crop year that corresponds most closely with their harvest period. For Brazilian soy, as an example, the physical window for harvest begins in April or May – six months off from the Northern Hemisphere harvest in September and October. That production will be grouped into the 23/24 crop year. The table below spells out the crop-year conventions for the major traded commodities. In some instances, the term ‘marketing year’ is used in place of crop year in the context of a world trade or demand orientation.
Supply – Crop Area
Crop production is the key driver of supply. Production is a function of the area devoted to growing a particular crop. Getting a read on production begins with estimating area. While the crop year begins with harvest, the growing season begins with seeding, so forecasting area is done well in advance of the crop year itself.
Two critical reports for area are the March Prospective Planting Report and the June Acreage Report.
Published each year on the last business day of March, the Prospective Planting Report is compiled by the National Agriculture Statistics Service (NASS) agency of the USDA. The March report is based on farmer surveys administered by NASS and is the first marker to building a production estimate for the coming crop. It is sometimes referred to as the “Intentions Report” since it captures farmers' responses to the question of what they intend to plant. The survey date typically preceeds any actual field work being done, so while it is based on actual responses, it is a forward-looking report.
Multiple factors can spur changes in farmer behavior after that, including weather that encourages or delays planting of a particular crop, relative price movements between crops, and the availability and price of required inputs to grow the crop.
The June Acreage Report (released on the last business day of June) is also produced by NASS, but its purpose is to estimate the actual acres planted to each crop. Based on farmer surveys conducted in the first two weeks of June, the report reflects the impact of planting-season variables on planting outcomes.
Let’s look briefly at how the orientation and timing of these two reports could help create a trading strategy.
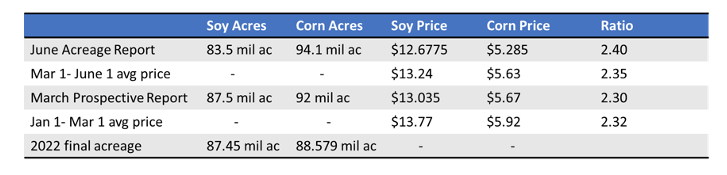
In the first three months of 2023 leading up the NASS Prospective Planting Survey, the average daily ratio of bean price to corn price was 2.32. (As corn has a higher expected yield per acre than beans, soybeans need to carry a price premium to make it worthwhile to plant.) On March 31, NASS reported projected soy acres of 87.5 million – about the same as the previous year – while corn acres were projected at 92 million acres – up about 4%. On June 30, the release of the NASS Acreage report reflected further increases in corn acres planted – up to 96 million – along with a 5% reduction for bean acres.
The swing in these numbers sent soy markets soaring and tanked corn markets. Could any traders have anticipated such a large swing? Interestingly, across the period between the two survey windows, (March-June), the ratio of soybeans over corn improved to 2.35 and continued to improve further in the days leading up to the release of the report. The collective market, as represented by each day’s futures prices, was reflecting the transition to corn acres that was happening at the expense of beans, foreshadowing the confirmation NASS provided with the June 30 Acreage report.
By knowing the window when surveys were being conducted, a trader could read the relative price movements as an indicator of the direction (if not necessarily the magnitude) of the changes to be reflected between the two NASS reports. Adding one layer to this, a trader could also presume that any change in absolute acres between beans and corn would have a relatively higher price impact in corn than in beans, given the higher yield per acre for corn than beans. One acre switched has a more significant impact on total corn production than beans, adding leverage to a bias on the move in acres between the two crops. The dynamics of the most recent Plantings and Acreage reports illustrate how understanding the specifics behind publicly reported data can help traders navigate and profitably position around events.
Supply – Yield
Having established the importance of area to the supply equation, let’s turn now to the second, and more dynamic, production variable – yield.
While estimates of area tend to be fixed at a point in time, estimates of yield evolve on an almost continual basis over the course of the growing season. Any rain event, windstorm or weather forecast has the potential to generate a market response during the key growing period. To avoid getting lost in this most critical period, it is helpful for traders to know what guideposts are available and how to use them to navigate a path through the volatility of the growing season.
A good start to understanding production estimates is the USDA’s Annual Outlook. Released in February each year in conjunction with the Outlook Forum meetings in Washington, this report is the first official publication from the USDA for the upcoming crop year. The Annual Outlook takes a research-paper approach, drawing from multiple resources within the USDA to produce figures for global production and consumption of key commodities.
Historically, the Outlook has relied heavily on the concept of “trendline” yields and “normal” weather. Trendline yields are an attempt to remove the year-to-year impact of yield volatility and reflect the fact that, over time, improvements in farming practices and technology have been able to improve production consistently. The statistical modeling behind trendline yields creates the base-case expectation for the coming crop.
From this baseline, the USDA will issue an updated forecast as part of the monthly World Agriculture Supply and Demand Estimates (WASDE). Production of the WASDE report is overseen by the same Work Agriculture Outlook Board as the Annual Outlook. And while the Outlook is more of an academic exercise, the month-by-month WASDE reports rely increasingly on the sub-agency resources such as the Farm Service Agency and the Agricultural Marketing Service to provide real-world inputs and data to improve forecasts and revise previous estimates. It is this iterative process that provides the credibility for the WASDE to be the source of record for global production for most commodity traders.
Once the crop is the ground, market watchers have two publicly available regular indicators to help assess crop health and prospects. The first is the weekly Crop Progress report issued by NASS. The primary data to produce the report is provided by farmers, who are arguably in the best position to evaluate the crop. The report provides information on how far the crop has progressed physically (e.g. how much of the crop has been planted, has it emerged, is it flowering) and how it is faring health-wise.
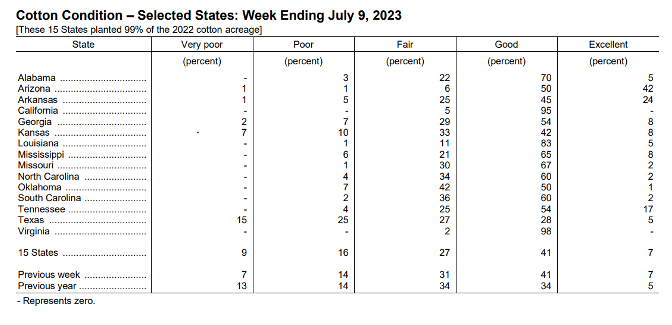
The report produces a Condition Score, which allocates the crop health into five tiers totalling 100 percent (Excellent-Good-Fair-Poor-Very Poor). The report includes state-by-state breakdowns as well as a comparison of current conditions versus the previous week and versus the same week one year prior. And although it is tenuous to translate condition scores directly into yield projections, the methodology of the report does align well with the concept of trendline yields, allowing for a direct comparison of the crop’s perceived health currently versus prior years. The week-by-week comparison also serves as a signal of whether the current crop is improving or declining in the period between USDA monthly Crop Production reports. A sample of the weekly Crop Condition score for cotton is shown here.
For all its value however, the Progress report is backward-looking. To truly stay current on the state of the crop, market watchers need some real-time and forward-looking information on yield prospects – and that is where weather and weather forecasting data come into play.
It is a truism that “rain makes grain”. Not surprisingly, the proliferation of weather data and analysis in the agricultural trading area is immense and intimidating. Much of it is held proprietarily or only available on a subscription basis. But there are credible and reliable public sources and – in most cases – it is this same primary public data that is packaged in the for-fee services.
Organized under the US Department of Commerce, the National Oceanic and Atmospheric Administration (NOAA) produces and publishes the bulk of the weather data used in agriculture and other industries.
Sub-agencies under this umbrella have distinctive but complimentary focuses. The National Weather Service provides temperature and precipitation records on both a summarized and a granular level, allowing it to be used for high-level analysis or in conjunction with county-by-county planting information from the USDA. Of particular value in NWS reporting and forecasting data are hourly rainfall figures – a day-long soaking rain has a different impact on crop prospects than a one-hour cloudburst, even though both may contain the same overall rainfall amount.
But the tool that is most widely applied in the commodity realm is the NWS 6-10 day outlook. The reference period for the forecast is 6-10 days from its issuance and the forecast assesses the likelihood of Normal, Above or Below Normal precipitation and temperature in the forecast period. The methodology resonates with agri-traders for its alignment with the concepts of “trendline yields” and “normal” weather, while the tenor of the forecast is nearby enough to increase reliability but forward-looking enough to create opportunity. Released in graphic form, the national 6-10 day outlook can be easily digested and mapped to areas of greatest interest to a particular trader. An example is shown here:
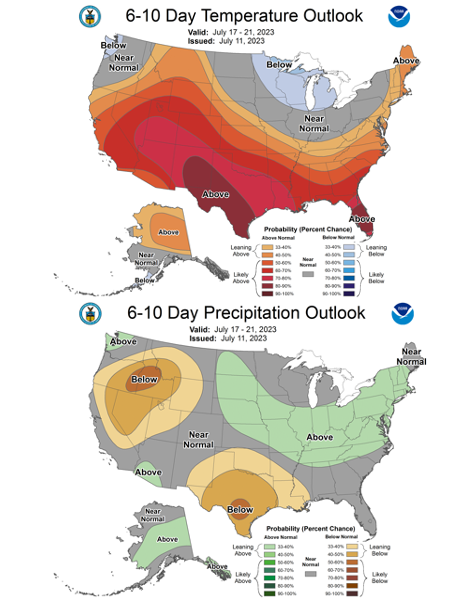
Let’s look now at how the elements we have discussed above – the monthly USDA production estimates, the weekly crop condition scores and NWS 6-10 day outlook – can be combined to form a framework to approach and anticipate market actions.
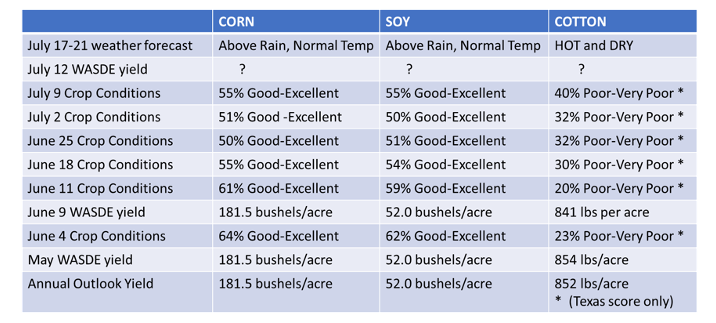
Note the forecast release date above is July 11, just prior to the release of the updated WASDE report on July 12, which traders know will include for the first time the updated Acreage Report figures. The weather forecast coverage period is July 17-21, so even as new production figures are being printed traders will be filtering that through an expectation of above-normal precipitation across a broad band of the US Midwest (soy and corn crop-growing areas) and a hot, dry pocket in Texas (wheat and cotton). Traders can also look at weekly condition scores in the weeks preceding and following the WASDE to further gauge incremental changes in crops. The table below illustrates a partial summary of these inputs for some critical crops.
How might a trader have navigated the market using this information?
For corn: Favorable condition scores would have supported a bias for unchanged yields between the Annual Outlook and the June WASDE. Declining scores between the June and July WASDEs could be reflected in slightly lower yield projections, but probably not significant enough to offset the large acreage increases as called out in the June Acreage report. Weather outlook coming out of the WASDE is favorable. Overall, probably not much to act on.
For soy: Favorable condition scores would have supported a bias for unchanged yields between the Annual Outlook and the June WASDE. A modest decline in scores between the June and July WASDEs does not support major increases in yield in the July report, so the acreage decline reported on June 30 should still be the dominant fundamental feature, although continued favorable weather would support some upward bias on yields in subsequent months.
For cotton: A marked decline in Texas crop conditions appears to have been only moderately reflected in the June yield decrease versus May, giving reason to anticipate possible yield reductions in the upcoming WASDE. Weather forecasts suggest a continuation of a hot dry pattern could further stress the crop – will the July report fully anticipate more problems?
Trying to anticipate new information coming into the market is an ongoing challenge for traders. Gauging to what extent that information has already been anticipated and priced is another challenge. But properly armed with an understanding of how the fundamental inputs are assembled, an informed trader can more confidently plot their own course through.
This content is for educational purposes only and is NOT financial advice. Before acting on any information you must consult with your financial advisor.